
SAP SAC Key Features

Easy Data Analysis and Visualization
SAP Analytics Cloud has intuitive tools that allow users to explore their data, create interactive dashboards, and generate meaningful reports. These visual representations make it easier to analyze and understand complex data patterns.

Planning and Forecasting
With powerful planning and predictive analytics tools, SAP Analytics Cloud enables companies to create well-founded future forecasts based on their data. Users can also model scenarios and create and adapt financial plans directly within the platform.

Integration and Connectivity
SAP Analytics Cloud integrates seamlessly with existing SAP and non-SAP systems, enabling access to real-time data and providing a unified view of all company data. It can handle both on-premise and cloud data sets, ensuring flexible data management.
Data Analytics and Visualization in SAP SAC for Your Teaching
SAP UCC Magdeburg provides access to the SAP Analytics Cloud environment for data modeling and visualization. A total of up to 100 students can access the learning environment simultaneously. The sales data of the fictitious model company Global Bike enables a vivid demonstration and testing of relevant processes and procedures.
Lecturers have access to teaching materials, such as ready-to-use presentations, exercises, and case studies that can be used both in teaching and in research projects.
The entire curriculum is available in both in German and English.
Theory and Navigation
This introduction provides an overview of the core concepts of SAP Business Data Cloud (BDC) and SAP Analytics Cloud, establishing the foundation for the subsequent case studies.
Topics covered include:
- Fundamentals of SAP Business Data Cloud (BDC) and SAP Analytics Cloud
- Key terms and concepts in the context of modern data platforms
- Core functionalities and use cases of both solutions
This exercise introduces navigation within SAP Analytics Cloud.
Upon completion, users will be able to confidently navigate the environment and independently carry out exercises and processes.
Introduction
In this case study, students learn the fundamentals of data analysis and visualization and apply SAP Analytics Cloud in a hands-on scenario.
A basic sales dashboard for Global Bike’s middle management is developed.
Key activities include:
- Exploring different model types
- Creating a story
- Visualizing data using the Story Builder
In this case study, students create an analytical model, load it with their own data, and analyze the results.
The focus is on:
- Understanding dimensions and measures in an analytical model
- Building an analytical model
Creating and evaluating a story based on the model
This case study introduces the creation and use of datasets in SAP Analytics Cloud.
Students learn the complete lifecycle—from dataset creation to its use in stories—as well as the importance of datasets as the foundation for Smart Predict methods.
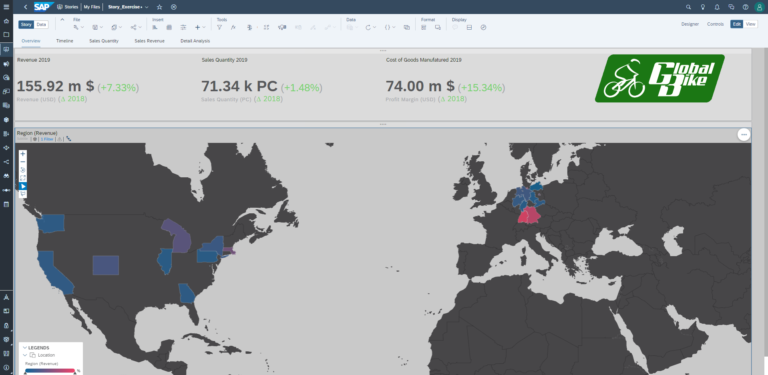
This case study focuses on creating a dashboard for executive-level presentations using geospatial data and the presentation mode in SAP Analytics Cloud.
Students develop a dashboard that presents Global Bike as an innovative company.
Key steps include:
- Creating a model with geospatial data
- Developing a story using GeoMap
- Creating an additional story with revenue data
- Building a presentation using the Story Builder Presentation Mode
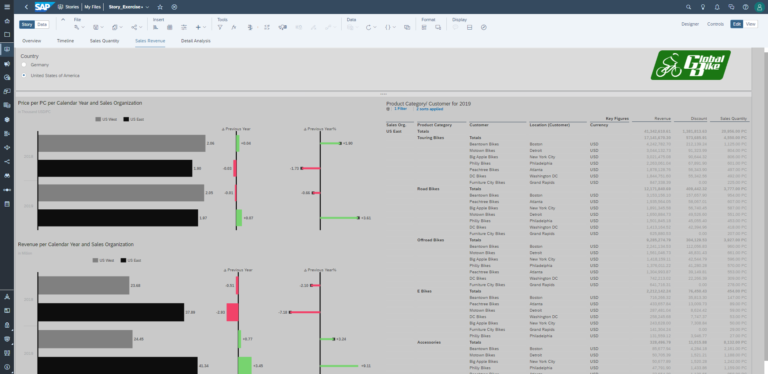
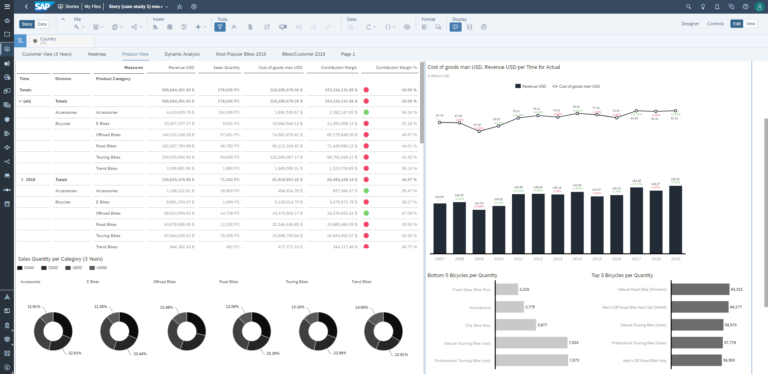
This case study builds on the Story Builder and focuses on developing an advanced sales dashboard with dynamic, scripted components.
Students independently create an advanced story and enhance it with dynamic functionality.
The dashboard includes:
- Designing a layout grid for structured organization
- Creating donut charts, bar charts, and scatter plots
- Integrating descriptive attributes
- Analyzing best- and worst-performing products
- Building a navigation area
- Analyzing top-N customers
- Applying scripting for dynamic behavior
Planning
This case study introduces the core concepts of enterprise planning in SAP Analytics Cloud.
Students:
- Create an initial planning model based on historical data
- Explore manual planning functions
- Use copy and editing features for planning data
- Plan sales data for the model company Global Bike
This case study deepens planning capabilities and demonstrates different approaches to defining and applying calculations within a planning model.
Students:
- Define calculations within the planning model
- Apply calculations using sales price examples
- Use results for analysis and planning purposes
- Further develop the existing planning model
This case study introduces advanced planning concepts and the creation of a value driver tree in SAP Analytics Cloud.
Students:
- Build a value driver tree to visualize key influencing factors
- Analyze the impact of market growth, price changes, and cost developments
- Examine effects on key figures such as revenue and contribution margin
- Develop a structured and transparent representation of cause-and-effect relationships
Predictive
This case study provides an introduction to predictive analytics in SAP Analytics Cloud and covers various machine learning-based forecasting methods.
Students:
- Learn how to create Smart Predict models
- Apply different forecasting methods to datasets
- Generate predictions based on historical data
- Gain hands-on experience with predictive analytics
Sustainability
This case study focuses on analyzing sustainability-related key figures and presents Global Bike as a responsible player in the mobility sector committed to climate protection.
Two models and one story are created to analyze the carbon footprint. Prior completion of the Story Builder and Modeler case studies is recommended.
Students:
- Calculate key figures to determine the carbon footprint of business travel
- Build, link, and use two models:
- Participant data (origin, mode of transport)
- Emissions data for different transportation modes (car, train, airplane, etc.)
- Develop a story to visualize and analyze the results
SAP SAC Dashboard Examples
Request a free trial version now!
The SAP UCC offers academic teaching staff free 30-day trial access to Data Analytics and Visualization in SAP SAC, including educational materials. If you are interested and for more information, click the button to contact our customer service.
Please note: This offer is only available to academic teaching staff. Students should contact their teacher.
Das sagen die Dozierenden

How Your Apprenticeship Continues
The SAP UCC Magdeburg offers you further practical curricula on current SAP solutions so that you can realise the full potential of your teaching and your students.